Investigating the Social World
Practice Exercises
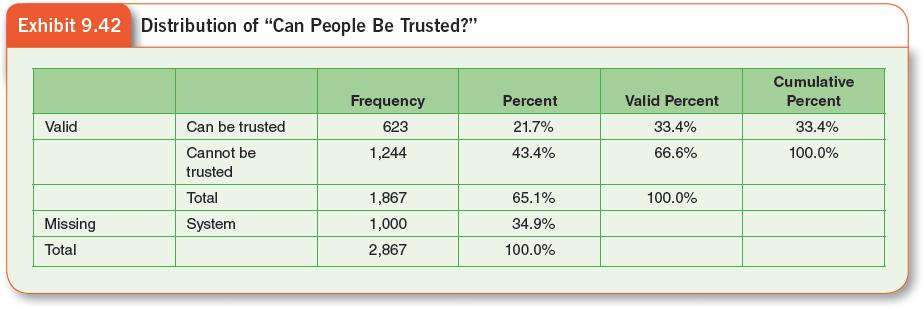
1. Exhibit 9.42 shows a frequency distribution of “trust in people” as produced by SPSS with the 2016 GSS data. As you can see, the table includes abbreviated labels for the variable and its response choices, as well as the raw frequencies and three percentage columns. The first percentage column (Percent) shows the percentage in each category of trust; the next percentage column (Valid Percent) is based on the total number of respondents who gave valid answers (1,867 in this instance). It is the Valid Percent column that normally should be used to construct a frequency distribution for presentation. The last percentage column is Cumulative Percent, adding up the valid percentages from top to bottom.
Redo the table for presentation, using the format of the frequency distributions presented in the text (such as Exhibit 9.10).
2. Try your hand at recoding. Start with the distribution of the political ideology variable from Exhibit 9.10. It is named POLVIEWS in the GSS. Recode it to just three categories. What decision did you make about grouping? What was the consequence of this decision for the shape of the distribution? For the size of the middle category?
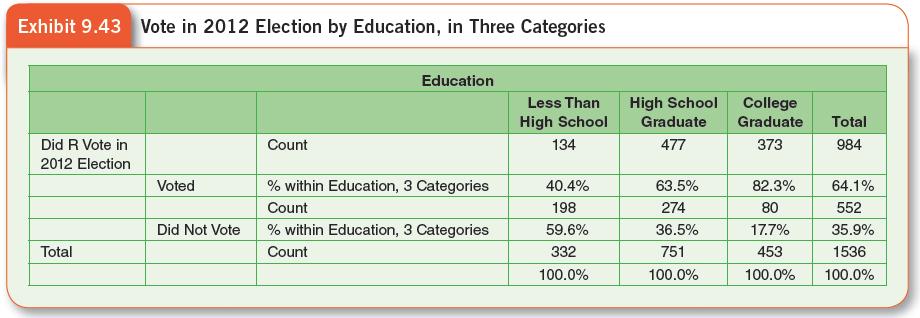
3. Cross-tabulations produced by most statistical packages are not in the proper format for inclusion in a report, and so they have to be reformatted. Referring to Exhibit 9.43, rewrite the table in presentational format, using one of the other tables as your guide. Describe the association in the table in terms of each of the four aspects of association. A chi-square test of statistical significance resulted in a p value of .000, meaning that the actual value was less than .001. State the level of confidence that you can have that the association in the table is not due to chance.

4. What if you had to answer this question: What was the income distribution of voters in the 2012 elections, and how did it compare with the income distribution for those who didn’t vote? Can you answer this question exactly with Exhibit 9.23? If not, change the column percentages in the table to row percentages. To do this, you will first have to convert the column percentages back to cell frequencies (although the frequencies are included in the table, so you can check your work). You can do this by multiplying the column percentage by the number of cases in the column, and then dividing by 100 (you will probably have fractional values because of rounding error). Then, compute the row percentage from these frequencies and the row totals.
5. Exhibit 9.43 contains a cross-tabulation of voting by education (recoded) directly as output by SPSS from the 2016 GSS data set. Describe the row and column marginal distributions. Try to calculate a cell percentage using the frequency (count) in that cell and the appropriate base number of cases.
6. Now, review the data analysis presented in this Cohen and Chaffee (2012) article in which statistics were used. What do you learn from the data analysis? Which questions do you have about the meaning of the statistics used?
7. Complete the Interactive Exercise for Chapter 9.

