SPSS Exercises
Producing Confidence Intervals Around a Mean
SPSS calculates confidence intervals around a sample mean or proportion with the Explore procedure. Activate the Explore procedure by selecting the Analyze menu, Descriptive Statistics, then Explore. The opening dialog box has spaces for both dependent and independent variables.
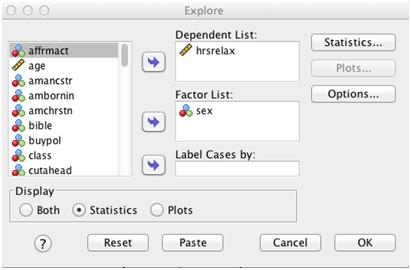
Place HRSRELAX (after an average work day, about how many hours do you have to relax or pursue the activities you enjoy?) in the Dependent List box, and SEX (respondent’s sex) in the Factor List box, as shown in Figure 7.1. We expect a gender difference in average relaxation hours, with women having less hours than men. The GSS asked respondents about their relaxation time after an average workday. In fact, social scientists have documented how women (not men) assume a second shift after work, managing family responsibilities at home, and consequently having less time for themselves.
Click on the Statistics button. Note that the Descriptives choice also includes the confidence interval for the mean, which by default is calculated at the 95% confidence level. Let’s change that to the 99% level by erasing the “95” and substituting “99.”
Figure 7.1. Explore Dialog Box for HRSRELAX and SEX

Click on Continue to return to the main dialog box. Recall that Explore produces several statistics and plots by default. For this example, we don’t need to view the graphics, so click on the Statistics button in the Display section. Click on OK to run the procedure.
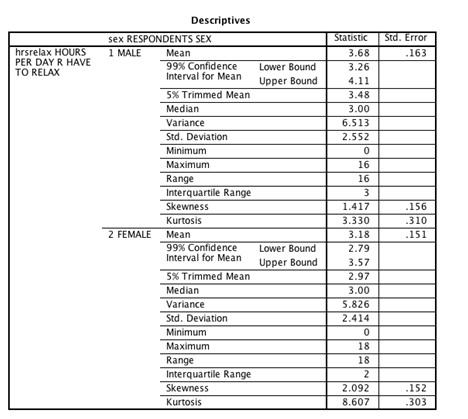
The output from the Explore procedure (Figure 7.2) is divided into two parts, one for males and one for females. The mean number of HRSRELAX for males is 3.68; for females, it’s 3.18. Our data indicate that, on average, men have slightly more time to relax in a day.
Figure 7.2. SPSS Output for HRSRELAX by SEX

The 99% confidence interval for males runs from 3.26 to 4.11 hr. One way to interpret this result is to state that, in 100 samples each of size 244 males from the U.S. adult population, we would expect the confidence interval to include the true population value for the mean ideal number of children 99 times out of those 100. We can never be sure that in this particular sample, the confidence interval includes the population mean. Still, our best estimate for the average relaxation hours per day falls within a narrow range of 0.85 (4.11 – 3.26). For females, the 99% confidence interval is 2.79–3.57 hr, with a range of .78 (3.57 – 2.79).
We’ll continue to explore the relationship between gender and relaxation hours in chapter.
SPSS Problems [GSS14SSDS-b]
1. Recall that the GSS sample includes men and women from 18 to 89 years of age. Does it matter that we may have responses from men and women of diverse ages? Would our HRSRELAX results change if we selected a younger sample of men and women?
a. To take the SPSS demonstration one step further, use the Select Cases procedure to select respondents based on the variable AGE who are less than or equal to 35 years old. Do this by selecting Data and then Select Cases. Next, select If Condition is satisfied and then click on If. Find and highlight the variable AGE in the scroll-down box on the left of your screen. Click the arrow next to the scroll-down box. AGE will now appear in the box on the right. Now, tell SPSS that you want to select respondents who are 35 years of age or less. The box on the right should now read AGE ≤ 35. Click Continue and then OK.
b. Using this younger sample, repeat the Explore procedure (with the 99% confidence interval) that we just completed in the demonstration. What differences exist between men and women in this younger sample on hours per day the respondent has to relax? How do these results compare with those based on the entire sample?
2. Calculate the 90% confidence interval for the following variables, comparing lower, working, middle, and upper classes (CLASS) in the GSS sample. Use the Explore procedure using CLASS as your factor variable (Analyze, Descriptive Statistics, Explore). Make a summary statement of your findings. (Make sure you reset Select Cases to All cases.)
a. HRSRELAX (hours to relax per day)
b. EDUC (Respondent’s highest year of school completed)
c. HRS1 (work hours per week)
d. MAEDUC (Mother’s highest year of school completed)
