SPSS Exercises
Selecting a Random Sample
In this chapter, we’ve discussed various types of samples and the definition of the standard error of the mean. Usually, data entered into SPSS have already been sampled from some larger population. However, SPSS does have a sampling procedure that can take random samples of data. Systematic samples and stratified samples can also be drawn with SPSS, but they require the use of the SPSS command language.
When might it be worthwhile to use the SPSS Sample procedure? One instance is when doing preliminary analysis of a very large data set. For example, if you worked for your local hospital and had complete data records for all patients (tens of thousands), there would be no need to use all the data during initial analysis. You could select a random sample of individuals and use the subset of data for preliminary analysis. Later, the complete patient data set could be used for completing your final analyses.
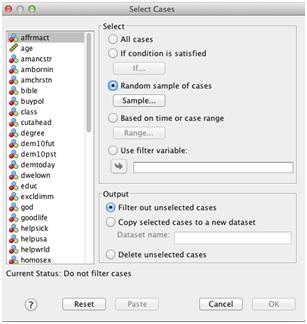
To use the Sample procedure, click on Data from the main menu, then click on Select Cases. The opening dialog box (Figure 6.1) has five choices that will select a subset of cases via various methods. By default, the All cases button is checked. We click on the Random sample of cases button, then on the Sample button to give SPSS our specification.
Figure 6.1. Select Cases Dialog Box

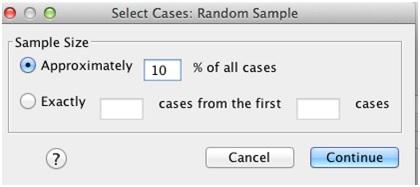
The next dialog box (Figure 6.2) provides two options to create a random sample. The most convenient one is the first, where we tell SPSS what percentage of cases to select from the larger file. Alternatively, we can tell SPSS to take an exact number of cases. The second option is available because SPSS will only take approximately the percentage specified in the first option.
Figure 6.2. Specifying Sample Size When Selecting Cases

We type “10” in the box to ask for 10% of the original sample of 1,500 respondents from the GSS. Then click on Continue and OK, as usual, to process the request.
SPSS does not delete the cases from the active data file that aren’t selected for the sample. Instead, they are filtered out (you can identify them in the Data View window by the slash across their row number). This means that we can always return to the full data file by going back to the Select Cases dialog box and selecting the All cases button.
When SPSS processes our request, it tells us that the data have been filtered by putting the words “Filter On” in the status area at the bottom of the SPSS window (the status area has many helpful messages from SPSS).
To demonstrate the effect of sampling, we ask for univariate statistics for the variable HRS1, measuring the number of hours a respondent worked last week. Click on Analyze, Descriptive Statistics, and then Descriptives to open this dialog box. Place HRS1 in the variable list. Click on the Options button to select the mean, standard deviation, minimum, and maximum values. In addition, we’ll add the standard error of the mean by clicking the S.E. mean box. Then click Continue and OK to put SPSS to work.
The results (Figure 6.3) show that the number of valid cases is exactly 87, or 10% of the valid cases (those who responded to the number of hours worked last week). The mean of HRS1 is 42.38 and the standard error of the mean is 1.78. If we repeat the process, this time asking for a 25% sample, we obtain the results shown in Figure 6.4.
Your results may differ from the results presented here. We are asking SPSS to generate a random selection of cases, and you may not get the same selection of cases as we did.
How closely does the mean for HRS1 from these two random samples match that of the full file? The mean for all 895 respondents (the other 605 respondents did not have valid responses) is 41.47 years. Both samples produced means and standard deviations that are within the range of the population parameters.
Figure 6.3. Descriptive Statistics for Number of Hours Worked Last Week, 10% Sample

Figure 6.4. Descriptive Statistics for Number of Hours Worked Last Week, 25% Sample

SPSS Problems [GSS14SSDS-B]
Using GSS14SSDS-B, repeat the SPSS demonstration, selecting 25%, 50%, 75%, and 100% samples and requesting descriptives for MAEDUC and PAEDUC. Compare your descriptive statistics with descriptives for the entire sample. What can you say about the accuracy of your random samples?
