SPSS Exercises
SPSS Demonstration [GSS14SSDS-B]
Producing Z Scores With SPSS
In this chapter, we have discussed the theoretical normal curve, Z scores, and the relationship between raw scores and Z scores. The SPSS Descriptives procedure can calculate Z scores for any distribution. We’ll use it to study the distribution of education in the GSS 2014 file. Locate the Descriptives procedure in the Analyze menu, under Descriptive Statistics, then click Descriptives. We can select one or more variables to place in the Variable(s) box; for now, we’ll just place EDUC (years of education) in this box. Check the box in the bottom left corner (Save standardized values as variables), create standardized values, or Z scores, as new variables. Any new variable is placed in a new Column in the Data View window and will then be available for additional analyses. Click on OK to run the procedure.
The output from Descriptives (Figure 5.1) is brief, listing the mean and standard deviation for EDUC, plus the minimum and maximum values and the number of valid cases.
Figure 5.1. Descriptives for Education

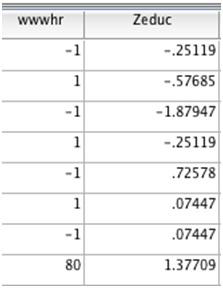
Though not indicated in the Output window, SPSS has created a new Z score variable for EDUC. To see this new variable, switch to the Data View screen. Then, go to the last Column, scrolling all the way to the right (Figure 5.2). By default, SPSS appends a Z to the variable name, so the new variable is called ZEDUC. The first case in the file has a Z score of –.25199, so the education years for this person must be below the mean of 13.77. If we locate the respondent’s EDUC score, we see that the score for this person was 13 (not pictured) or below the mean as we expected. There may be missing values for ZEDUC. Missing values include those that the question did not apply to, those that outright refused to provide occupational information, or those data entry errors that resulted in an invalid answer.
Figure 5.2. The Creation of the Z Score Variable for EDUC

If the data file is saved, the new Z score variable will be saved along with the original data and then can be used in analyses. In addition, if we have SPSS calculate the mean and standard deviation of ZEDUC, we find that they are equal to 0 and 1.00, respectively.
SPSS Problems [GSS14SSDS-B]
1. The majority of variables that social scientists study are not normally distributed. This doesn’t typically cause problems in analysis when the goal of a study is to calculate means and standard deviations--as long as sample sizes are greater than about 50. (This will be discussed in later chapters.) However, when characterizing the distribution of scores in one sample, or in a complete population (if this information is available), a non-normal distribution can cause complications. We can illustrate this point by examining the distribution of age in the GSS data file.
a. Create a histogram for AGE. Click on Analyze, Frequencies (select AGE), Charts, and Histograms (select Show normal curve on histogram). How does the distribution of age deviate from the theoretical normal curve?
b. Calculate the mean and standard deviation for AGE in this sample, using either the Frequencies or Descriptives procedure.
c. Assuming the distribution of AGE is normal, calculate the number of people who should be 25 years of age or less.
d. Use the Frequencies procedure to construct a table of the percentage of cases at each value of AGE. Compare the theoretical calculation in (c) with the actual distribution of age in the sample. What percentage of people in the sample are 25 years old or less? Is this value close to what you calculated?
2. In the SPSS Demonstration, we examined the distribution of EDUC (years of school completed).
a. What is the equivalent Z score for someone who has completed 18 years of education?
b. Use the Frequencies procedure to find the percentile rank for a score of 18.
c. Does the percentile rank that you found from Frequencies correspond to the Z score for a value of 18? In other words, is the distribution for years of education normal? If so, then the Z score that SPSS calculates should be very close, after transforming it into an appropriate area, to the percentile rank for that same score.
d. Create histograms for EDUC and the new variable ZEDUC. Explain why they have the same shape.
3. Run separate analyses for men versus women (SEX) based on the variable EDUC and ZEDUC. [Click on Data, Split File, Organize Output by Groups and select SEX.] Answer Questions 2a-d separately for men and women.
