SPSS Exercises
Demonstration 1: Producing Measures of Central Tendency With Frequencies
The Frequencies command, which we demonstrated in chapter 2, also has the ability to produce the three measures of central tendency discussed in this chapter. We will use Frequencies to calculate measures of central tendency for EMAILHR (number of e-mail hours per week) and TVHOURS (hours per day watching television).
Click on Analyze, Descriptive Statistics, then Frequencies. Place EMAILHR and TVHOURS in the Variable(s) box. Then click on the Statistics button. You will see that the Central Tendency box lists four choices, but we will click on only the first three--Mean, Median, and Mode. Then click on Continue, then on OK to process this request.
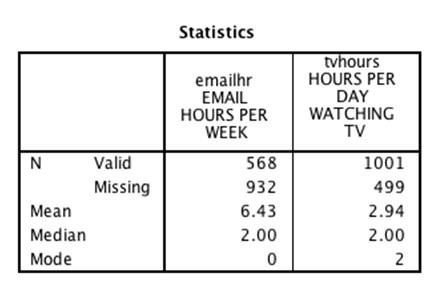
The statistics box for EMAILHR and TVHOURS is displayed here (Figure 3.1). Both variables are interval-ratio measurements. Though we’ve instructed you to select the Mean, Median, and Mode for your output, the mean is the most appropriate measure of central tendency. SPSS produces exactly the output we asked for, without regard for whether the output is correct for this type of variable. It’s up to you to select the proper measure of central tendency.
Figure 3.1. Statistics Output for EMAILHR and TVHOURS

Demonstration 2: Producing Measures of Central Tendency With Descriptives and Split File
Suppose we want our results split by sex, allowing us to separate results for males and females. Select Data, Split File, Organize Output by Groups. Insert the variable sex into the box labeled “Groups Based on.” Click OK. Now SPSS will filter our results by sex.
When you want to calculate the mean of interval-ratio variables but you don’t need to view the actual frequency table listing the responses in each category, the Descriptives procedure is often the best choice. Descriptives can be found by clicking on Analyze, Descriptive Statistics, and then Descriptives.
The Descriptives dialog box is uncomplicated and requires only that you place the variables of interest (AGE, EMAILWK, and TVHOURS) in the Variable(s) box. By default, Descriptives will calculate the mean, standard deviation (to be discussed in the next chapter), minimum, maximum, and the number of cases with a valid response.
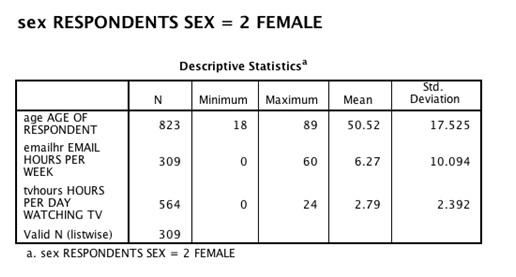
You will need to scroll through your SPSS output to locate the descriptive statistics for female respondents. Figure 3.2 displays these descriptive statistics for AGE, EMAILWK, and TVHOURS for female GSS respondents in 2014.
Figure 3.2. Descriptive Statistics for Females Only

The output from Descriptives automatically lists the variables in the order that we specified in the dialog box. Based on the output, we can determine that on average, female respondents were 50.12 years old, used their email 6.27 hr per week and watched 2.79 hr of television per day.
SPSS Exercises [GSS14SSDS-A]
1. Based on the last SPSS Demonstration on Descriptives, compare the means for each variable (AGE, EMAILHR, and TVHOURS) for men and women.
a. On average, which group is older, uses their e-mail more frequently and watches more television per day?
b. Program SPSS to split the file by DEGREE (respondent’s educational attainment) and run Descriptives for EMAILHR. Rank the DEGREE groups by the highest to lowest e-mail use per day.
2. Picking an appropriate statistic to describe the central tendency of a distribution is a critical skill. Determine the appropriate measure(s) of central tendency for the following variables: (remember to reset the Split File option--Analyze All Cases, Do Not Create Groups)
a. Respondent’s marital status [MARITAL]
b. Respondent’s general level of happiness [HAPPY]
c. Number of hours a respondent worked last week [HRS1]
d. Which presidential candidate respondent voted for in 2012 [PRES12]
e. Number of brothers and sisters of respondents [SIBS]
f. Beliefs about the Bible [BIBLE]
3. Create a frequency distribution, including any appropriate measures of central tendency, for PREMARSX (does the respondent approve of sex before marriage?).
a. Which measure of central tendency is most appropriate to summarize the distribution of PREMARSX? Explain why.
b. Suppose we are interested in whether attitudes about premarital sex vary by beliefs about the Bible. Create a frequency distribution, including any appropriate measures of central tendency, for PREMARSX, this time separating results for the categories in BIBLE. Are there any differences in their measures of central tendency? Explain.
4. Create a frequency distribution, including any appropriate measures of central tendency, for EDUC (years of education).
a. Which measure of central tendency is most appropriate to summarize the distribution of EDUC? Explain why.
b. Create a frequency distribution, this time separating results for SEX categories. Include in your analysis, the appropriate measure of central tendency. Are there any differences in their measures? Explain.
5. Some believe that social class influences an individual’s decision on the number of children to have. Use SPSS to investigate this question with the GSS data file. The variable CHILDS measures the respondent’s number of children. To produce the necessary information, have SPSS split the file by CLASS and then run Frequencies (and Statistics) for CHILDS.
a. What is the best measure of central tendency to represent the number of children in a household? Why?
b. Which social class has more children per respondent?
c. Rerun your analysis, this time with the variable CHLDIDEL (ideal number of children). Is there a difference among the social class categories? Explain.
