An Adventure in Statistics: The Reality Enigma
Student Resources
Jig:Saw’s puzzle solutions
Puzzle 1
When Zach entered the JIG:SAW complex he tried garlic, rTMS and Tasers to deter the zombie security. Afterwards, he decided to do a study to test which of these weapons was best. Based on his experiences, he predicted that Tasers and rTMS would be better deterrents than garlic, but that there would be no significant difference between Tasers and rTMS. He randomly assigned 5 people a Taser, 5 people an rTMS device, and 5 people a necklace of garlic. He then put them in a pit with 10 hungry zombies. He counted how many of the 10 zombies were incapacitated for each participant. The data are in Table 16.10 (in the book). Compute the F-ratio. Were there significant differences between the mean number of zombies incapacitated by the different weapons?
The summary table for the model is as follows:
Summary table of the model predicting the number of zombies incapacitated from the weapon used

Let's see how we calculate these values.
Calculate the sum of squared errors
First, we compute the total sum of squares:
![]()
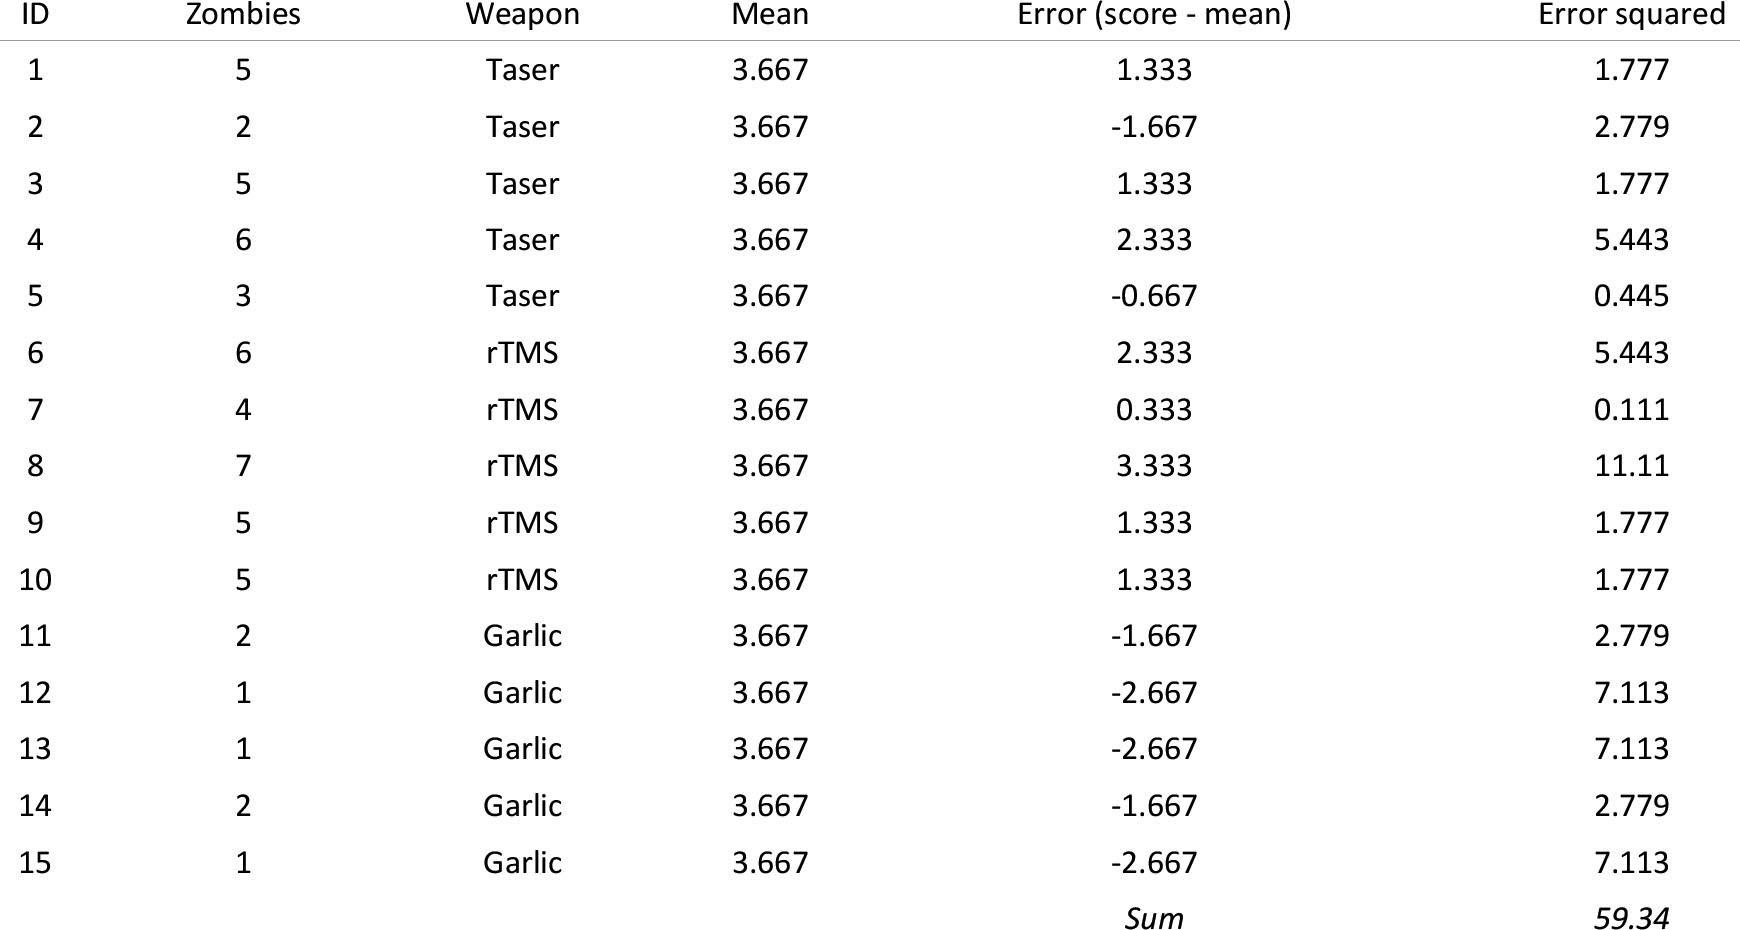
We arrive at this value by subtracting the grand mean from each score, squaring these differences and adding them up, as shown in the following tables:
Next, we calculate the model sum of squares:

Next, we calculate the residual sum of squares:

For each score we compute the difference between the score and the group mean, then square these differences and sum them, as shown in the following table:
Residual sum of squares for the Taser group

Residual sum of squares for the rTMS group

Residual sum of squares for the garlic group

Calculate the mean squared errors
We convert the sums of squares to mean squares by dividing by the degrees of freedom for each:

Calculate F
We calculate F as follows:
![]()
Conclusion
There was a significant difference in the mean number of zombies incapacitated by different weapons, F(2, 12) = 14.70, p < 0.001.
Puzzle 2
Based on Zach’s predictions, construct some contrasts and weights for those contrasts to test his predictions.
The contrasts and weights reflecting Zach's predictions are in the following table:
Contrasts and weights for Zach's two hypotheses

Puzzle 3
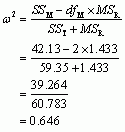
Calculate omega squared for the zombie data, and also calculate Cohen’s d for the difference between means of the three conditions (use the pooled estimate of the standard deviation).
Omega-squared
Cohen's d
Cohen’s d is defined as:
![]()
The pooled estimate of the standard deviation is:
![]()
The values and resulting calculations are tabulated below:
Cohen's d for pairwise comparisons of group means

Puzzle 4
Rob Nutcot used an oxytocin spray to try to make people trust him more. Zach set up an experiment to see whether oxytocin affected trust. He took 7 people who were delivered a speech about different products to keep you looking younger by three different people. Before each speech they were sprayed with either (1) a placebo that smelled like oxytocin spray but had no active ingredient, (2) a spray with a low dose of oxytocin in it, or (3) a spray with a high dose of oxytocin in it. Each participant was, therefore, exposed to each dose of oxytocin. The outcome was how much they believed the claims about the product (out of 10). The data are in Table 16.11. Calculate the F-ratio. Did oxytocin affect trust in the product?
The summary table for the model is as follows:
Summary table of the model predicting the belief in the product from the dose of oxytocin administered before the speech

Let's see how we calculate these values.
Calculate the sum of squared errors
First, we compute the total sum of squares:
![]()
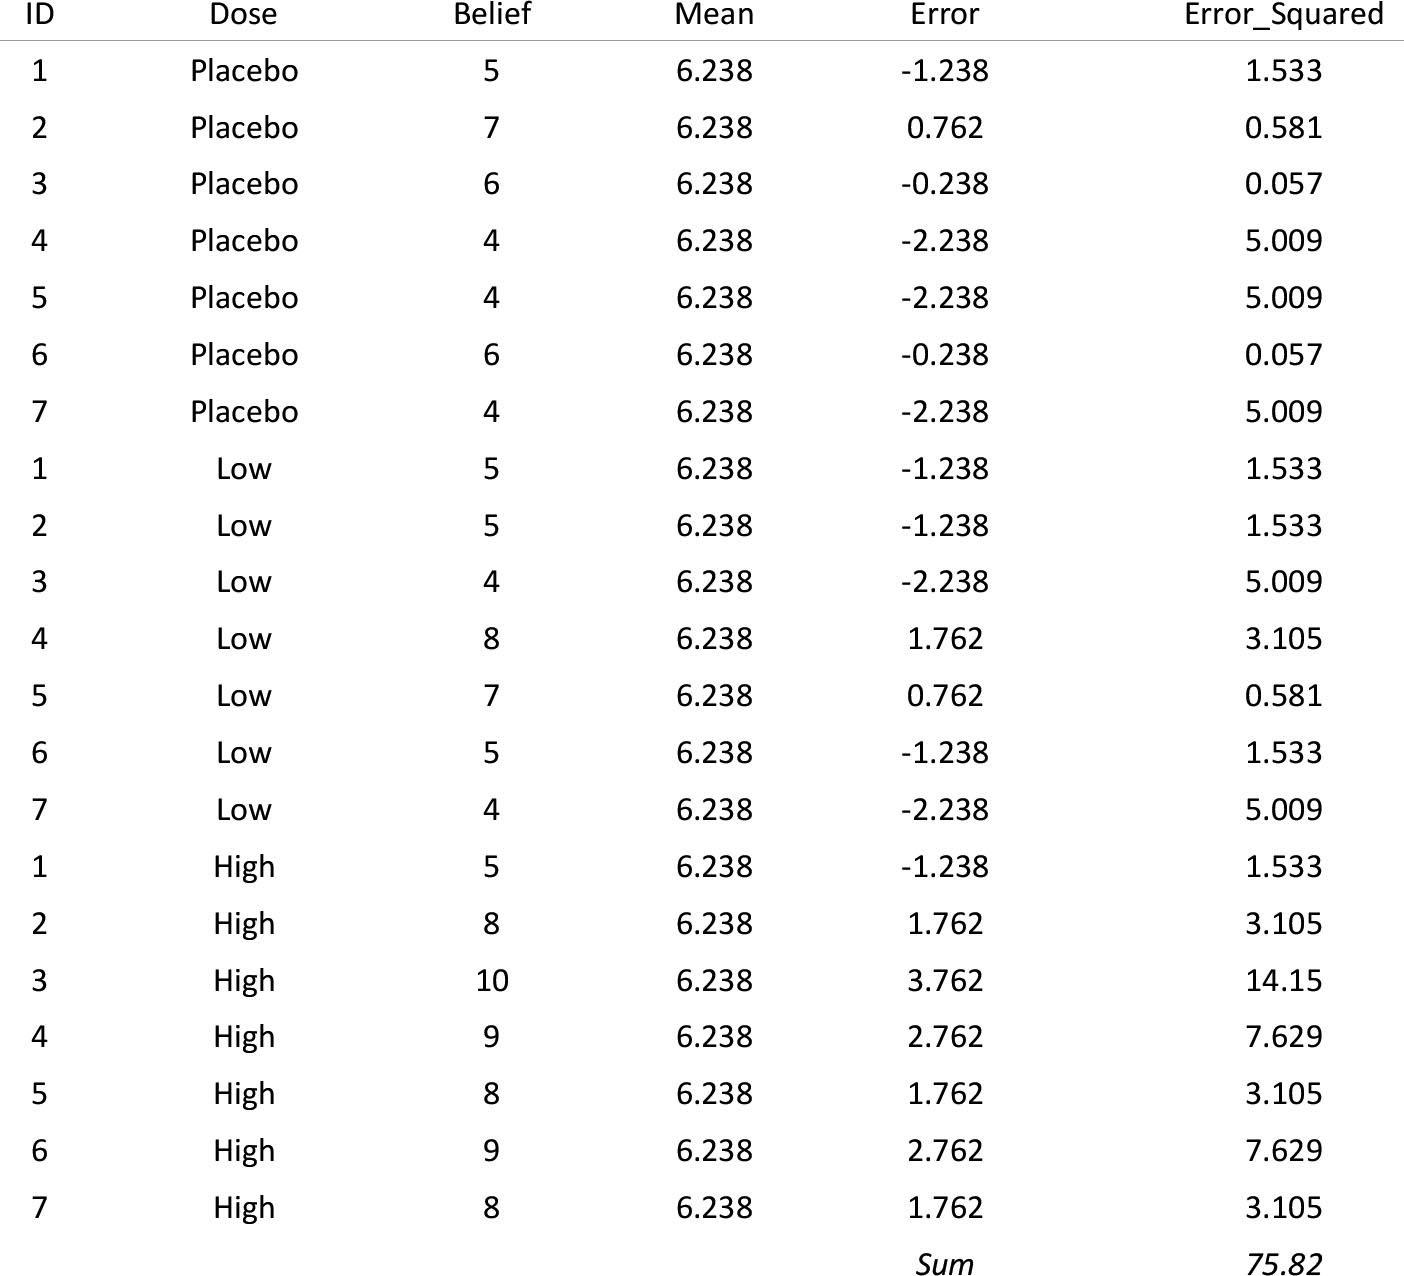
We arrive at this value by subtracting the grand mean from each score, squaring these differences and adding them up, as shown in the following tables:
Next, we calculate the model sum of squares:

Next, we calculate the within-participant sum of squares by calculating the sum of squared error within each participant and adding them up:

The sum of squared error for each participant is shown in the following table:
Table showing the sum of squared errors within each participant

Next, we calculate the residual sum of squares:


Calculate the mean squared errors
We convert the sums of squares to mean squares by dividing by the degrees of freedom for each:

Calculate F
We calculate F as follows:
![]()
Conclusion
There was a significant difference in the belief scores after different doses of oxytocin, F(2, 12) = 8.54, p = 0.005.
Puzzle 5
Earlier in his journey, Zach looked at some data showing the strength, footspeed and vision of different groups of JIG:SAW employees (code 1318, scientists, security, professional services and technicians; see Figure 9.1). There were 240 employees in total. Milton forced him reluctantly to test whether the mean strength differed across the five groups. Then, because he is an evil cat, he erased some of the values from the summary (Table 16.12). Can you help Zach to fill in the blanks? (Hint: think about the degrees of freedom first.)
- There were five groups being compared (code 1318, scientists, security, professional services and technicians), so the degrees of freedom for the model will be 4 (
 )
) - The total degrees of freedom will be:

- The residual degrees of freedom will be:

- We can work out the mean squared error for the model by dividing the sum of squares by the degrees of freedom:

- We can work out the residual sum of squared errors by multiplying the mean squared error by the degrees of freedom:

- We can work out the total sum of squares by adding the model and residual sum of squares:

- The F statistic is the mean squared error for the model divided by that for the residual:

Puzzle 6
That cat, Milton, is such a japester that he has done the same thing to the summary table (Table 16.13) for the comparison between means of footspeed across the five job types (see puzzle 5). Help Zach to fill in the blanks before he dies of tedium.
- There were five groups being compared (code 1318, scientists, security, professional services and technicians), so the degrees of freedom for the model will be 4 (
 )
) - The total degrees of freedom will be:

- The residual degrees of freedom will be:

- We can work out the model sum of squares by subtracting the residual sum of squares from the total sum of squares:

- We can work out the mean squared error for the model by dividing the sum of squares by the degrees of freedom:

- We can work out the mean squared error for the residual by dividing the sum of squares by the degrees of freedom:

- The F statistic is the mean squared error for the model divided by that for the residual:

Puzzle 7
When Celia was trying to woo Zach, she looked at whether there was a significant association between how you rated the costs and rewards of your relationship and openness to alternative relationships (see Reality Check 13.2). She decided to see whether you could manipulate a person’s openness to alternative relationships. She took five people and asked them to list all the costs and rewards of their current relationship, then asked them to rate their openness to alternative relationships. At another point in time she asked the same people to study a list of potential costs to being in a relationship and again got them to rate their openness to alternative relationships. At a final point in time she asked the same people to study a list of potential benefits or rewards to being in a relationship and again got them to rate their openness to alternative relationships. Each person completed these tasks a week apart and in random order. The data are in Table 16.14. Use these values to compute the F-ratio. Is openness to alternative relationships affected by focusing on lists of potential costs or rewards compared to generating your own costs and rewards?
The summary table for the model is as follows:
Summary table of the model predicting openness to a new relationship after studying different prompt lists

Let's see how we calculate these values.
Calculate the sum of squared errors
First, we compute the total sum of squares:
![]()
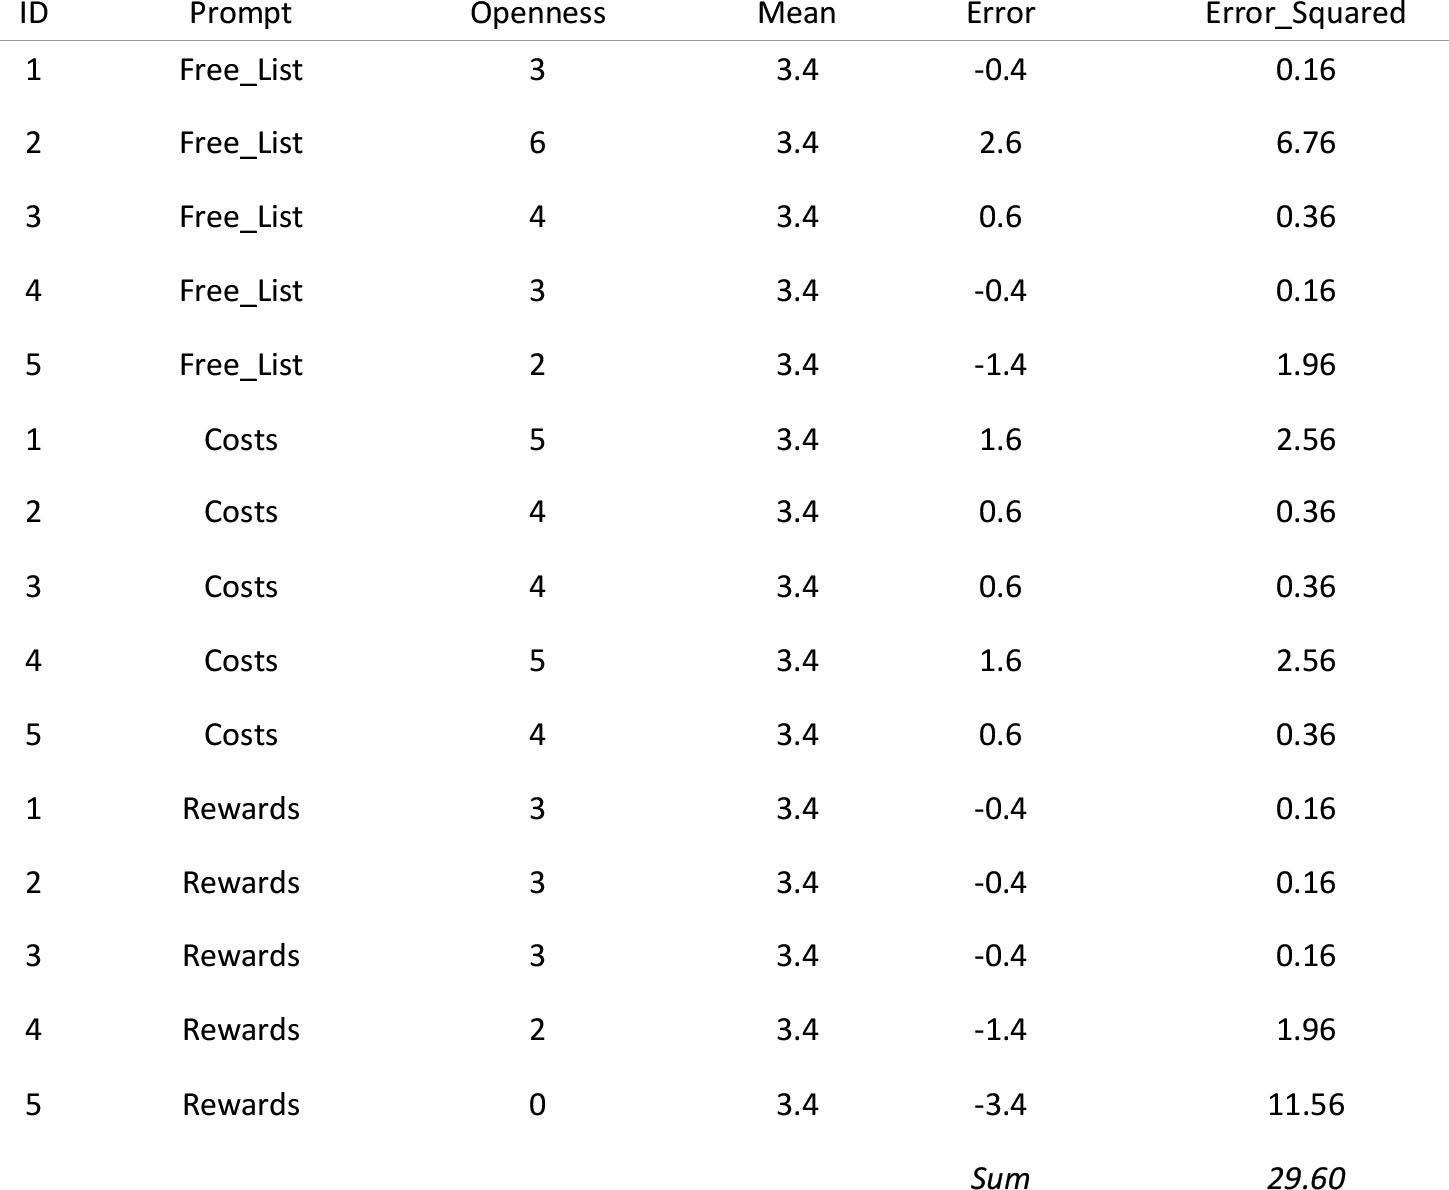
We arrive at this value by subtracting the grand mean from each score, squaring these differences and adding them up, as shown in the following tables:
Next, we calculate the model sum of squares:

Next, we calculate the within-participant sum of squares by calculating the sum of squared error within each participant and adding them up:

The sum of squared error for each participant is shown in the following table:
Table showing the sum of squared errors within each participant

Next, we calculate the residual sum of squares:


Calculate the mean squared errors
We convert the sums of squares to mean squares by dividing by the degrees of freedom for each:

Calculate F
We calculate F as follows:
![]()
Conclusion
There was a significant difference in the openness to a new relationship after different prompts to thing about pros and cons of relationships, F(2, 8) = 6.00, p = 0.026.
Puzzle 8
Output 16.13 shows the results of an analysis on the data in Table 16.14 (see puzzle 7), to compute a Bayes factor based on a reasonable default prior. Interpret this output.
The Bayes factor is 5.08, which means that the data are 5.08 times more likely given the alternative hypothesis compared to the null hypothesis. In other words, we should shift our belief in the alternative hypothesis (that these prompts change openness to new relationships) relative to the null by a factor of 5.08. This value 'has substance' but is not at all strong evidence for the alternative hypothesis (relative to the null). In other words we should shift our belief that these prompts change openness to new relationships a little, but not very much.
Puzzle 9
The second experiment in Alice’s report (Alice's Lab Notes 16.1), when Zach reanalysed it, seemed to suggest that sending visual images to someone’s ID chip while they recalled a memory would interfere with it (i.e., result in lower recall of the event). Roediger decided to do a follow-up study. He took 18 participants: 6 of them received no memory interference while they recalled an event, 6 received visual interference unrelated to the event they were recalling, and 6 received visual interference related to the event they were recalling. The data are in Table 16.15. Compute the F-ratio. Were there significant differences in recall between the three groups?
summary table for the model is as follows:
Summary table of the model predicting memory recall from the type of interference

Let's see how we calculate these values.
Calculate the sum of squared errors
First, we compute the total sum of squares:
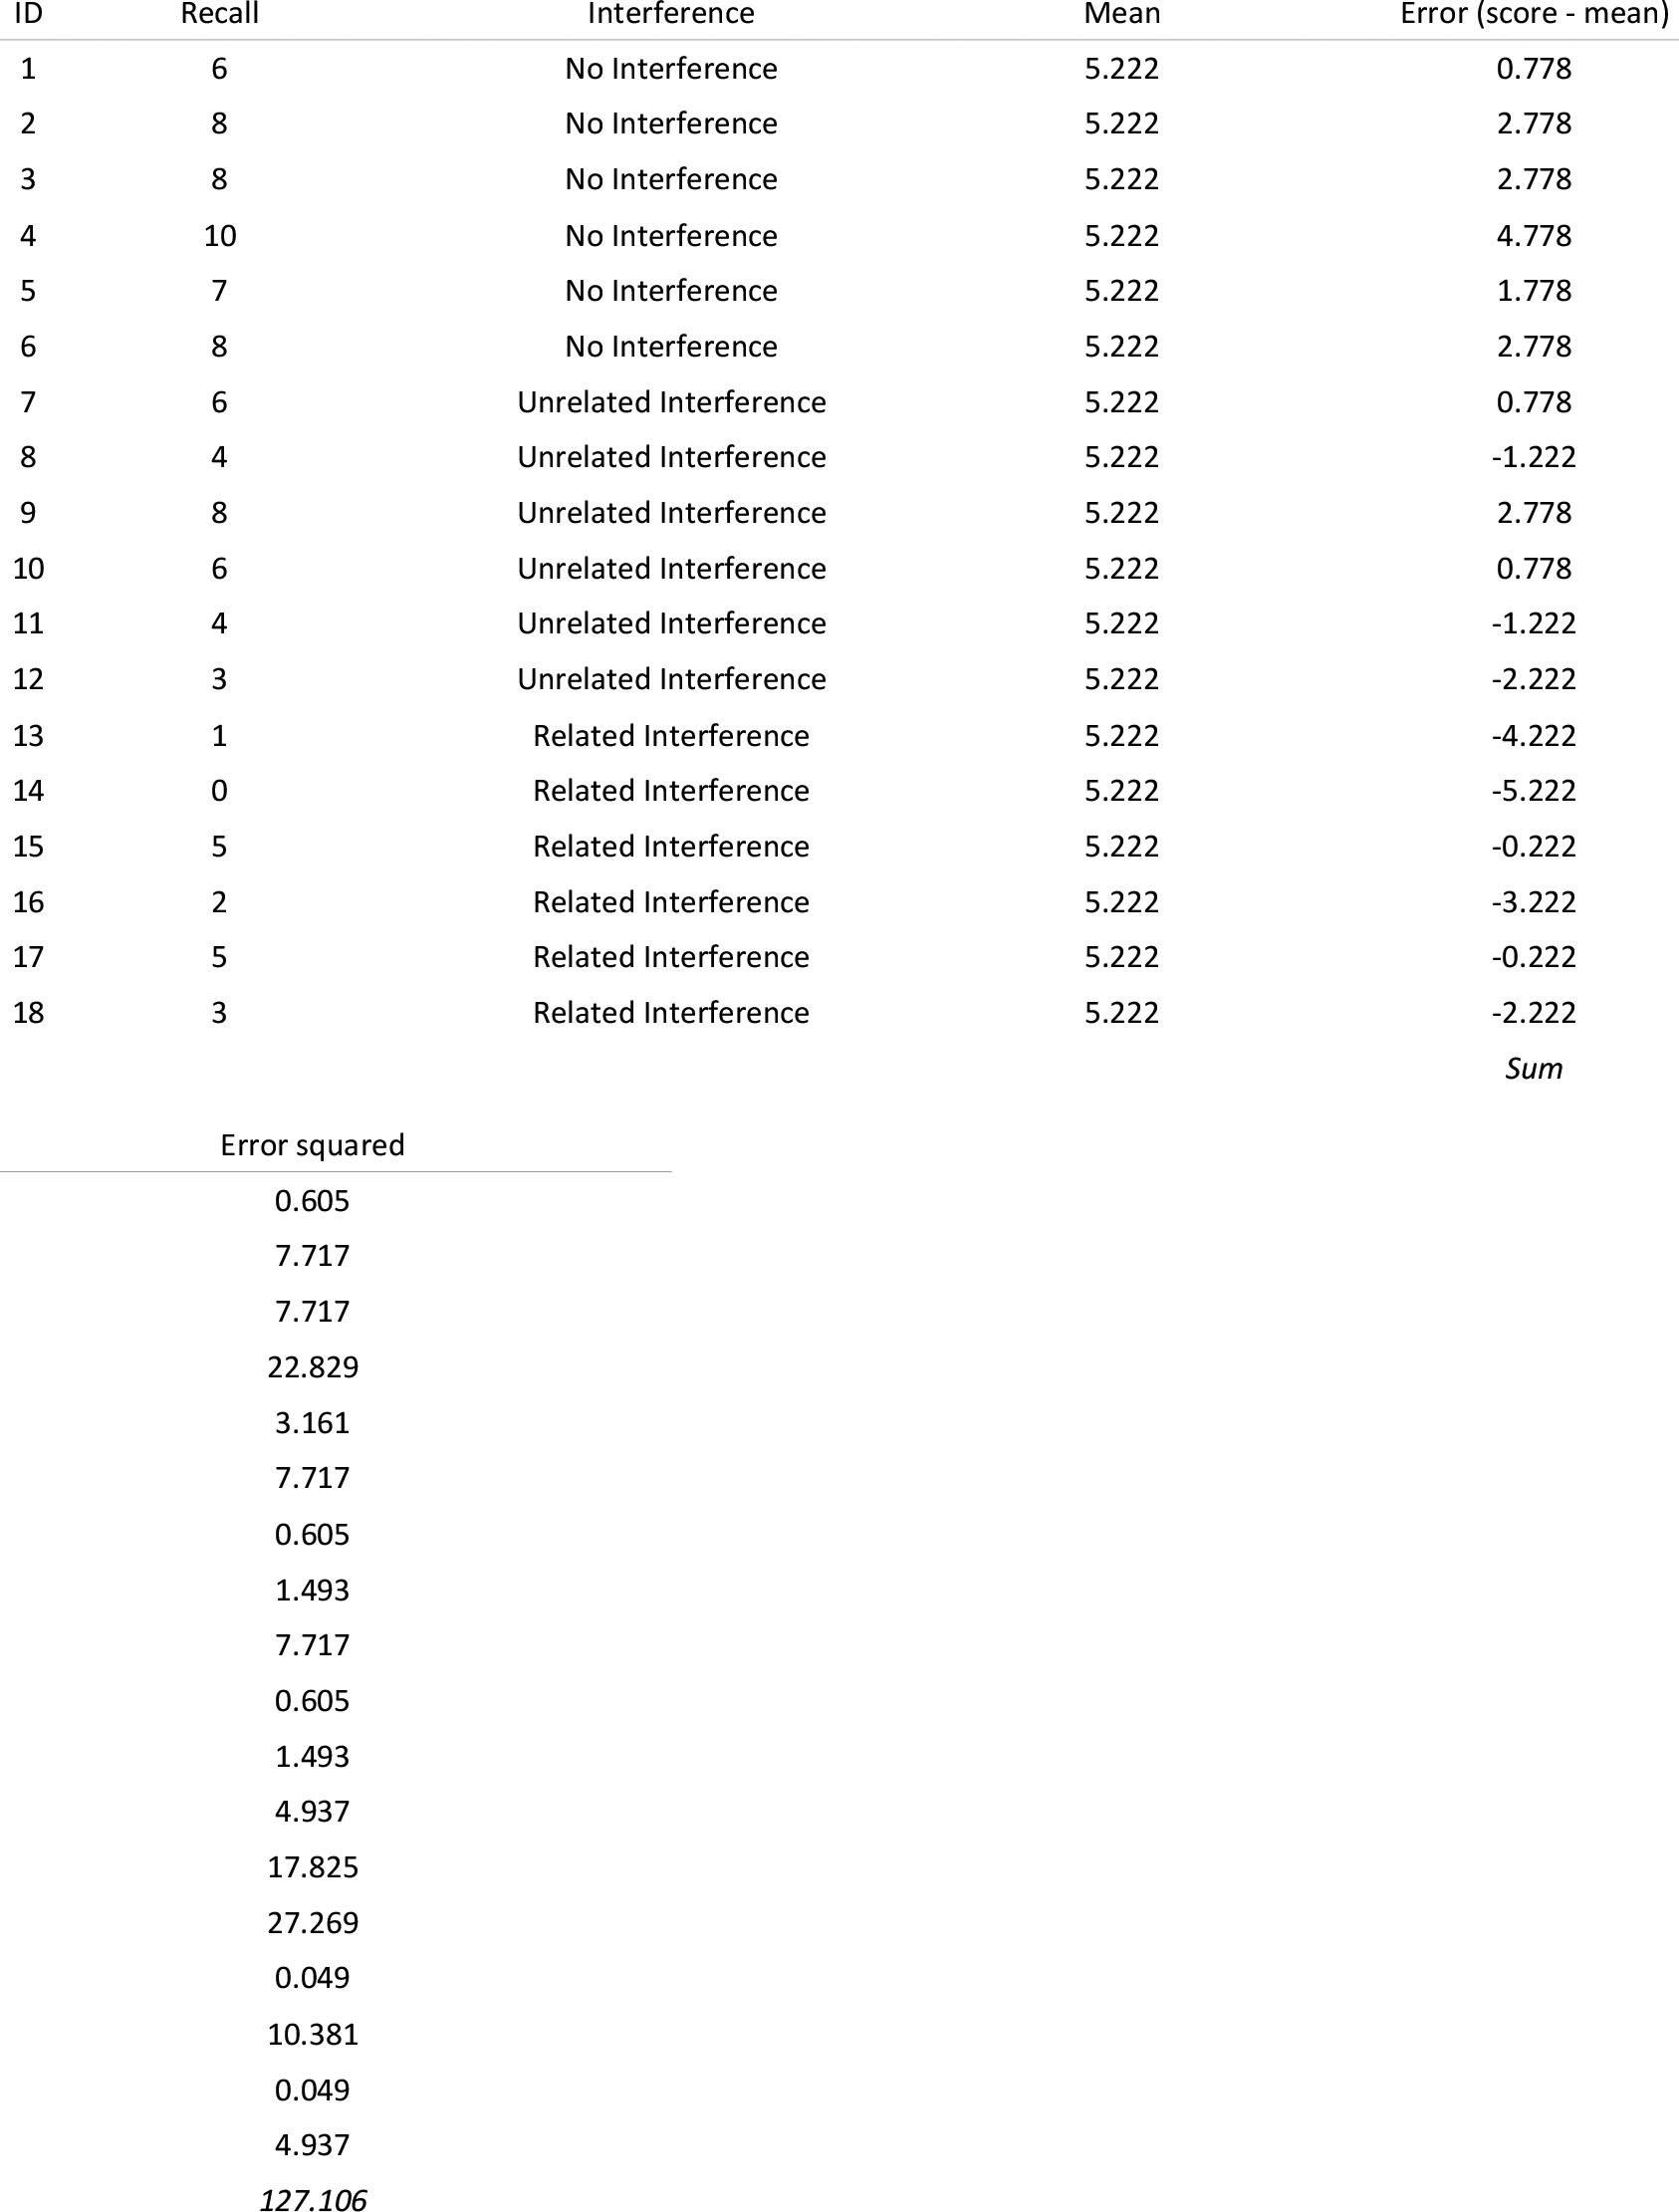
![]()
We arrive at this value by subtracting the grand mean from each score, squaring these differences and adding them up, as shown in the following tables:
Table continues below
Next, we calculate the model sum of squares:

Next, we calculate the residual sum of squares:

For each score we compute the difference between the score and the group mean, then square these differences and sum them, as shown in the following table:
Residual sum of squares for the no interference group

Residual sum of squares for the unrelated interference group (continued below)
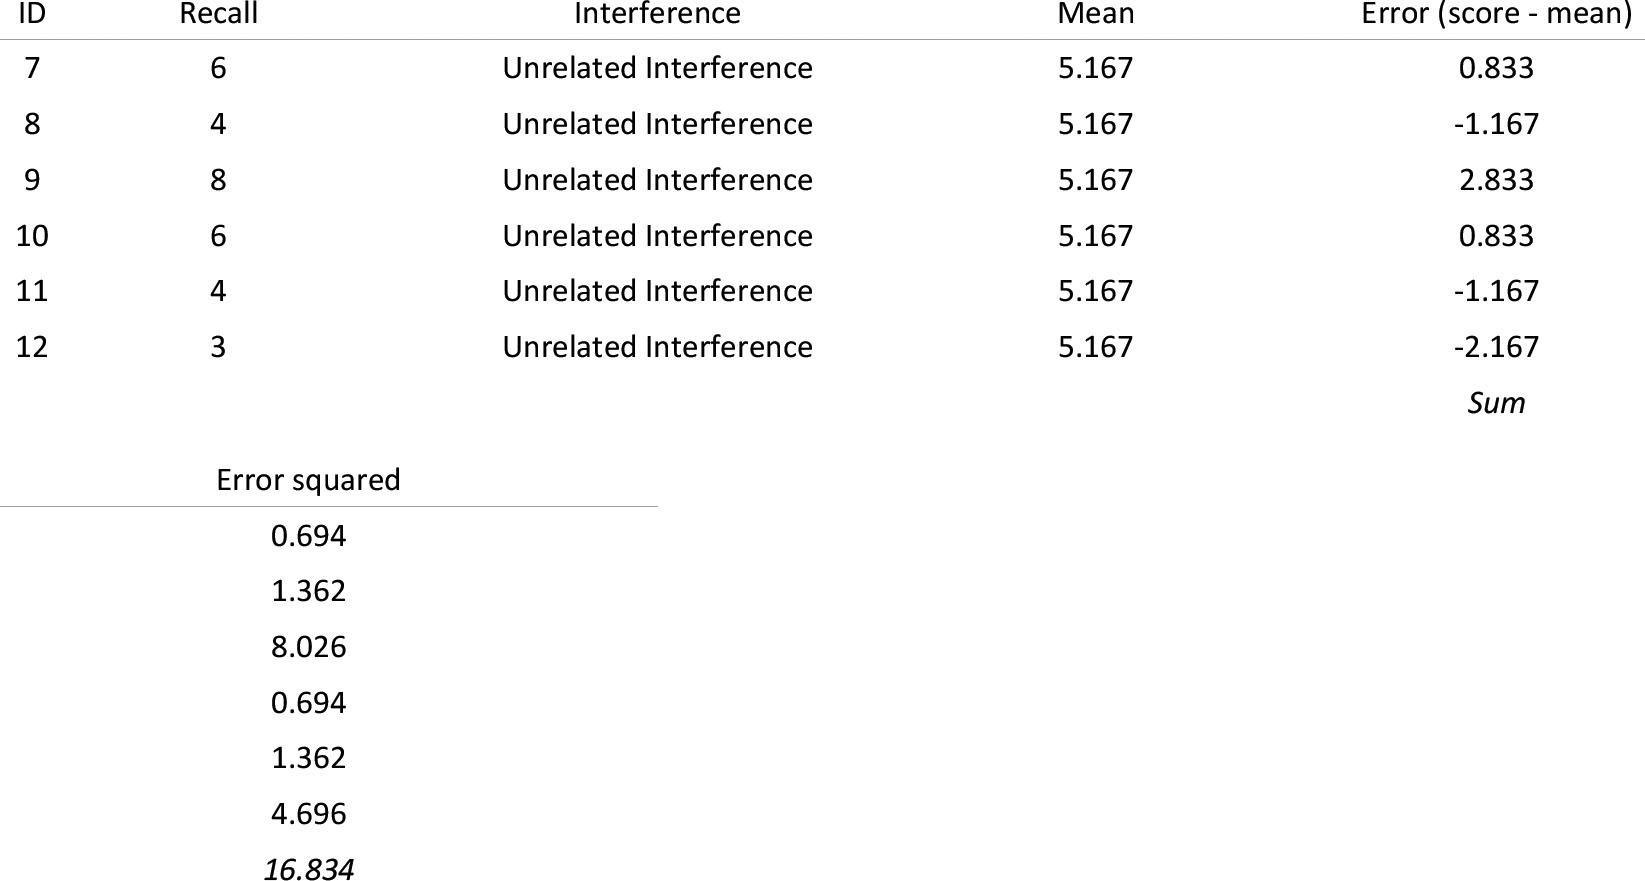
Residual sum of squares for the related interference group

Calculate the mean squared errors
We convert the sums of squares to mean squares by dividing by the degrees of freedom for each:

Calculate F
We calculate F as follows:
![]()
Conclusion
There was a significant difference in the mean recall after different types of interference, F(2, 15) = 12.80, p < 0.001.
Puzzle 10
Output 16.14 shows the results of an analysis on the data in Table 16.15 (see puzzle 9), to compute a Bayes factor based on a reasonable default prior. Interpret this output.
The Bayes factor is 51.57, which means that the data are 51.57 times more likely given the alternative hypothesis compared to the null hypothesis. In other words, we should shift our belief in the alternative hypothesis (that the type of interference affects memory) relative to the null by a factor of 51.57 This value is strong evidence for the alternative hypothesis (relative to the null). In other words we should shift our belief that the type of interference affects memory a fair amount.
