Management and Business Research
Answers to Exercises in the Book
The bar chart for each group looks like this.
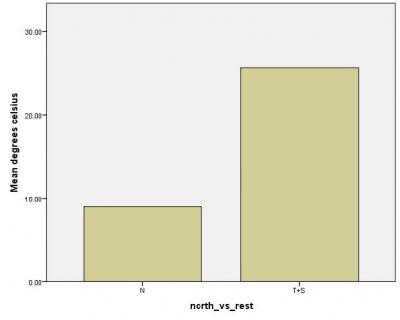
There are 69 cities in the northern hemisphere, with a mean temperature of 8.99 degrees Celsius. There are 25 cities in the combined tropics and southern hemisphere group, with a mean temperature of 25.60 degrees Celsius. Not surprisingly for December, the mean temperature for Northern cities is very much lower than the mean temperature for the Tropics and Southern hemisphere cities combined.
What are the main features of each group as shown by the boxplot, and what are the main differences?
The SPSS output box plot for each of the two groups looks like this.
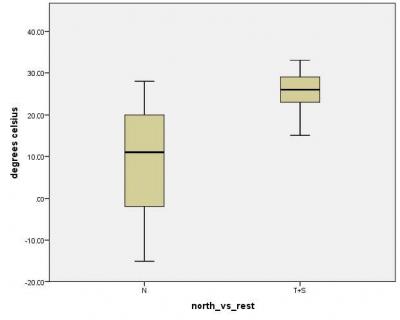
SPSS displays the following statistics for each boxplot: minimum, first quartile, median, third quartile, and maximum. The middle half of the data for each group (the area between the first quartile and the third quartile) is shown in the shaded areas of the boxplot (this is the ‘box’), while the solid bar inside the shaded box is the median. The largest and smallest values in each group are shown by what are sometimes called the ‘whiskers’.
Similar to the output from Exercise 10.1 (which showed the means), these boxplots show a big difference in the median temperatures of the two groups. Looking at the shaded boxes, we can also see that there is a bigger spread in temperatures for Northern hemisphere cities. The Southern and Tropical cities have much lower variation. There are extreme temperatures for both groups, as shown by the minimum and maximum scores marked with the whiskers in the two plots. For the Northern hemisphere, there are four cities (Dubai, Miami, Jerusalem and Tel Aviv) with a temperature which is higher than the median for the southern and tropical cities. Moscow is the coldest city in the Northern hemisphere, with a temperature that day of –15 degrees. For the Tropical and Southern hemisphere cities, the lowest temperature is Mexico City with a rather mild 15 degrees (at least for a Northern person). The hottest city is Bangkok with 33 degrees, just ahead of Mumbai with 32 degrees.
Note: Not all questions have answers, this is because some questions don't lend themselves to a clear correct answer - dicuss with you're tutor if you're not sure of your work on the questions not on this website.